
Statics displaying with bars and chart attracts more than the simple table of data. The growth data of any company, website, or a person is more expressive in graphical form.
Visual aids such as graphs, bars, pie charts, and more add perfection to your content. So, If you own a WordPress website then add these graphics too in your content.
Here, in this post, we will show you how to create Bar & Chart with WordPress visualizer plugin.

Points to remember in Bars and Charts with WordPress
There are a lot of plugins to add charts, bar, and graphs with your content. However, we have heard from our users that the most common complaint is that these plugins are usually very complex to use. So, be patient while using these plugin.
Some of these plugins also expect users to add data to a shortcode in highly complicated formats. As shortcodes are those special functions/tags that allows the user to quickly and easily pull related bits of mentioned functionality into their content.
At the place of using those plugins, many users end up creating the chart in their office applications and converting them into an image. Where plugin is defined as a type of software that contains a group of functions that can be added to a WordPress website. They are used to provide additional functionality to your application.
It can work if you are planning to never change it. Although, an image is no substitute for an interactive chart, where helpful data is displayed when the user moves his mouse into a particular section.
An ideal chart and graph solution will give you the following permission:
- Add data from the data source on your computer or the web.
- Create beautiful, interactive, colorful and mobile-friendly charts.
- The most important thing is that you can update the data whenever you want.
- Use your data to populate charts, pie, graphs, and bars.
Let’s see how Visualizer WordPress Charts and Graphs plugin helps you do all that.
Creating Bar & Charts with WordPress Visualizer Plugin
First, you have to install the Visualizer WordPress Charts and Graph plugin and then activate it.
To know more details for plugin installation read our blog how to install a plugin in WordPress.
Whenever the free version requires almost everything you need. Also, they have Visualizer Graphs and Charts Pro that adds advanced features in the plugin like adding data directly by using a spreadsheet-like interface and importing data from other charts.
With a year of professional support and updates, site license costs are $79.
Note: This guide is about the free version of the plugin.
After activated, you have to go to Media>>Visualizer Library page. This is where your all charts and graphs will appear.
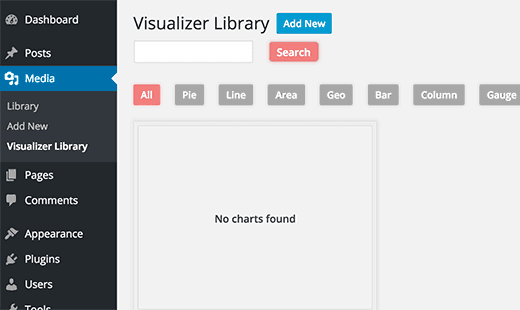
To add your first chart, you need to click the Add New button.
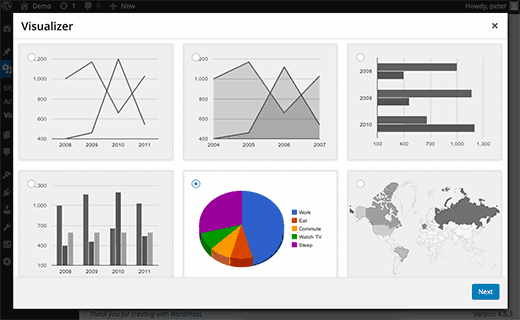
Moreover, it will bring a popup window to the screen. Here you will see a different chart type that is available with the plugin.
Just choose the chart type you want to add and click on the Next button to continue.
Next step is to add your data source in a CSV format. If you have saved your data as a spreadsheet by using Excel, Google Sheets or any other program, you can easily export it as a CSV file.
You can save or download your CSV file on your computer and after that upload it by clicking on the ‘From Computer’ button.
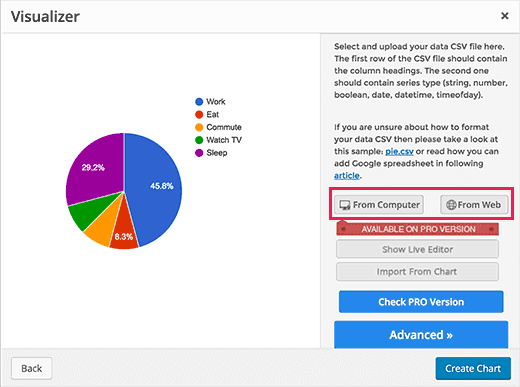
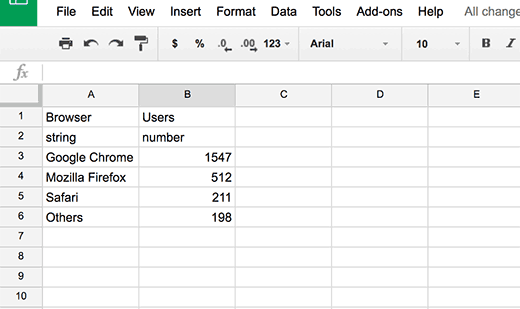
The first row in your CSV file should have the column name and the second line contains the data type. The plugin supports these data types: string, number, boolean, date, time date, and time of day.
Let’s see an example file we have created in Google Sheets.
However, if you create a CSV file by using a text editor, then see this example CSV file:
Browser, visitors
string, numbers
Chrome, 7894
Firefox, 6754
Internet Explorer, 4230
Safari, 2106
Opera, 627
Adding a Chart in WordPress by Using Google Drive Spreadsheet
Whereas, if you have your chart data stored in a spreadsheet on Google Drive, you can add it to your chart without exporting it.
Thereafter, open your data file in Google Spreadsheets. And then press, the File>>Publish to the web.
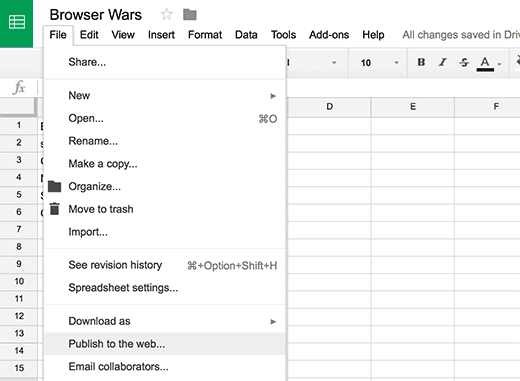
Although, this will bring a popup where you have to choose how you want to publish this document. Also, you have to choose Comma Separated Values (.csv) from the drop-down menu.
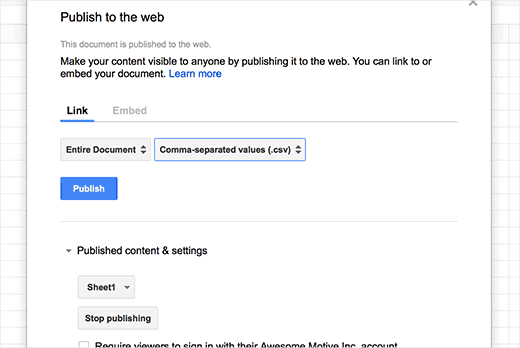
Don’t forget to press the ‘Publish’ button.
Here you will see your sheet’s publicly available URL as a CSV file. You have to copy this URL and go back to the Visualizer Chart.
Now click the From Web button and then enter the URL of the CSV file of your Google Spreadsheet.
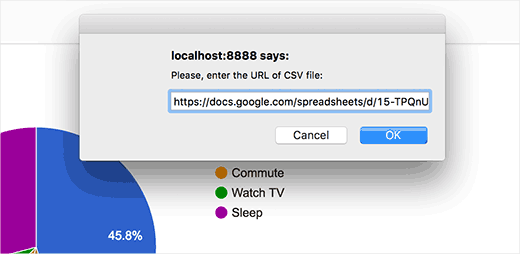
However, as soon as you enter the URL, the plugin will fetch your CSV file and display a live preview of your chart.
Now you can click the Create Charts button to save your chart.
Adding a Chart or Graph in WordPress Posts/Pages
Adding a chart or graph to your WordPress pages and posts is as simple as adding images. Where pages are like posts. Pages can be managed in a hierarchical structure in WordPress.
Further, create a new page or post or edit existing where you want to add a chart. On the edit screen, press the Add Media button above the post editor.
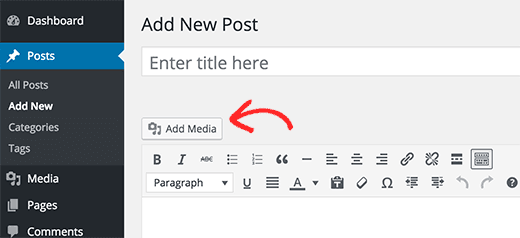
However, this will bring WordPress media upload popups. You will need to press the Visualization tab from the left column. This will load all the charts you created and will be saved on this website.
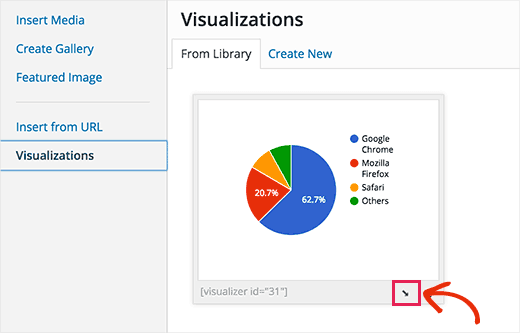
Also, click the Insert icon below your chart. The popup will disappear and you will see that your chart has been added to your WordPress post as a shortcode.
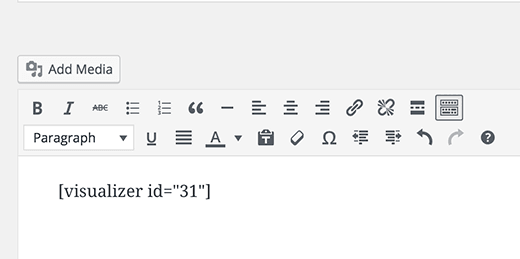
Now you can save your WordPress page or post and go to your website to see the embedded chart in your WordPress post. As, the articles posted by the admin of a WordPress site are called posts. As admin has full power over the site and can do everything related to the administration of the site. Administrators can create more administrators, invite new users, remove users, and change user roles.
Editing Your Visualizer Charts in WordPress
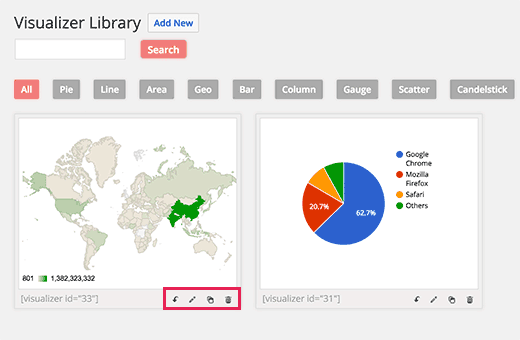
Indeed, you can edit and change your chart at any time. Just go to the Media>>Visualizer Library page. From there you can clone a chart, delete it, or edit its view settings.
Updating data for existing charts without changing the chart is quite easy with the visualizer.
However, if you have added data from Google Spreadsheets, all you have to do is update the data in your spreadsheet and go to File>>Publish to the web and republish your spreadsheet. Your changes will be automatically reflected in your chart.
On another side, if you uploaded a CSV file, then you have to update the CSV file on your computer.
Once complete, choose the chart you want to update and click the Edit link below the chart.
Thus, upload your new CSV file in the upload CSV file section. Changes in data will automatically appear in pages or posts where you have entered that chart.
Adding a Chart to WordPress Sidebar Widget
Although Visualizer uses shortcodes to insert charts. Just visit the Media>>Visualizer Library, where you will see a shortcode below your charts.
Furthermore, copy the shortcode and go to Appearance>>Widgets. Drag and drop a text widget to your sidebar and paste the shortcode into the widget.
As, Widgets allows you to add content and features to your sidebar without writing any code. There are some default widgets that come with WordPress such as Categories, Tag cloud, Search, etc. Also, sidebar is a theme feature, which is basically a vertical column provided by a theme for displaying information other than the main content of the web page.
The usage of sidebars changes and it depends on the choices of the theme designer. As, theme is a group of stylesheets and templates that are used to describe the appearance and display of a WordPress site. Templates are those files which control how your WordPress site will be displayed on the web.
Conclusion
Here, We have discussed a way to Create Bars and Charts in WordPress with Visualizer. Often, we concluded the Problems with Bars and Charts in WordPress.
We hope this post helped you to create Bars and Charts. If you have any questions about creating this, let me know in the comments section below. If you liked this post, please share it with your peers.
In case, you face any issue in dealing with your WordPress website. Contect our support team on our support phone number +1-888-738-0846(Toll-Free)
That’s all, thanks!
Read More Blogs: